Tracing
Distributed tracing adds tools to track the requests between services and applications on the DSH:
- The DSH has a microservices architecture, where processes communicate with each other over a network to fulfill a specific task.
- This results in many requests between processes, but not all of them may be visible to you as a tenant.
- Distributed tracing provides insights into individual requests as they propagate through the DSH.
- You can add the tracing instrumentation to your code using OpenTelemetry APIs and SDKs. The DSH includes Jaeger UI to inspect the collected traces.
- The DSH ensures that information about a tenant’s processes in a trace isn’t visible to other tenants.
Tip
See Tracing to learn how you can add tracing to your custom service on the DSH.
Requesting tracing
If you request a new tenant on the DSH, then the platform administrator typically adds tracing by default. However, if your tenant doesn’t have this platform service, then you can request it by creating a ticket in the DSH Support Portal:
- Click the “Support” button in the menu bar of the DSH Console. Log in to the DSH Support Portal if necessary.
- Click “New support ticket” next to the search bar.
- Fill out the following fields:
- Tenant: Enter the name of your tenant.
- Platform: In the dropdown menu, select the platform that you want to request tracing for.
- Requester: Enter your email address, or use the prefilled address of your account for the DSH Support Portal.
- Company: In the dropdown menu, select the company that you request the service for.
- Subject: Enter ‘Request tracing’.
- Contents: Provide any additional information.
- Click “Submit” to send the request. A platform administrator will process it.
OpenTelemetry concepts
The DSH uses the OpenTelemetry framework to handle tracing. The sections below describe key concepts in OpenTelemetry.
- Signal: A system output that describes the underlying activity of services and applications. On the DSH, a signal is typically a request that you want to trace as it passes through the different services and applications.
- Trace: A representation of the path that a request takes on the DSH. A trace consists of one or more spans.
- Span: A representation of an operation that a service or application executes in the path. A span has the following key-value pairs:
- Span name: The human-readable name of the operation.
- Span context: The context contains the span’s own unique ID, and the ID of the trace that the span is part of.
- Parent ID: The ID of the span that triggered the operation for the current span. If the parent ID is empty, then the span is the root span of the trace.
- Start and end timestamps: The start time and end time of the span.
- Span attributes: Key-value pairs that contain metadata about the operation that the span tracks. OpenTelemetry supports several Semantic attributes, which are naming conventions for common attributes.
- Span event: An event with a structured log message, associated with a single point in time during a span’s duration.
- Baggage: Information of a trace that should be available across all spans.
OpenTelemetry on the DSH
This section presents an example of tracing on the DSH, involving multiple tenants. It also discusses how DSH’s security model influences the visibility of spans inside a trace.
Example
The following example describes how a message moves through the DSH:
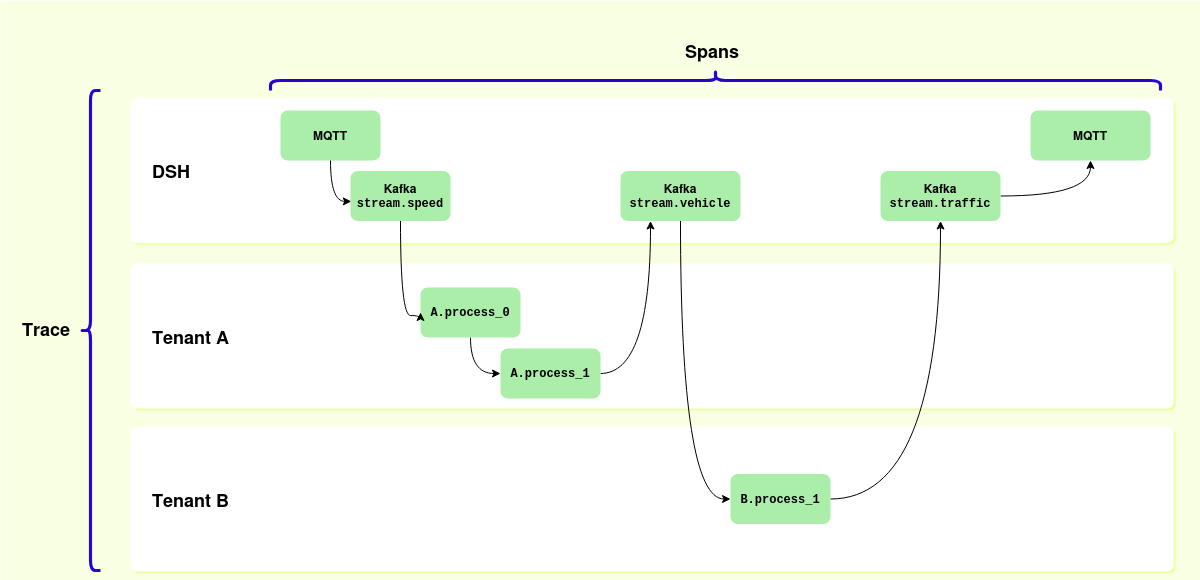
- An external client publishes a message to the DSH via the MQTT broker for the public stream
stream.speed. - The DSH publishes the message to
stream.speed. - Tenant A has subcribed to this stream, and picks up the message. Tenant A’s processes
A.process_0andA.process_1handle the message. - Process
A.process_1publishes the output to the streamstream.vehicle. - Tenant B has subscribed to this stream, and picks up the message. Tenant B’s process
B.process_1handles the message and publishes the output to the streamstream.traffic. - Via the MQTT broker, the DSH publishes the message to the outside world.
This results in the following abstract entries for the trace:
- DSH: MQTT -
stream.speed - DSH: Kafka -
stream.speed - Tenant A -
A.process_0 - Tenant A -
A.process_1 - DSH: Kafka -
stream.vehicle - Tenant B:
B.process_0 - DSH: Kafka -
stream.traffic - DSH: MQTT -
stream.traffic
The diagram above displays the following concepts:
- The complete path represents the trace.
- The individual nodes represent spans inside the trace.
- The arrows from one node to the next represent the parent-child relation between spans.
- The left-most “MQTT” span is the root span of the trace.
Security
On the DSH, tenants are strictly separated from each other. This results in the following logic for spans in a trace:
- A users can see a span if DSH messaging components (Kafka, MQTT, etc.) created it, and if that user can access the resource in question.
- A user can inspect a span related to a tenant if they have access to that tenant.
- The DSH anonymizes a span if the user inspecting it doesn’t have access to the tenant that created the span.
The table below describes this logic for the abstract entries of the example discussed above:
| User of tenant A can see span | User of tenant B can see span | |
|---|---|---|
DSH: MQTT - stream.speed |
Yes | Yes |
DSH: Kafka - stream.speed |
Yes | Yes |
Tenant A: A.process_0 |
Yes | No |
Tenant A: A.process_1 |
Yes | No |
DSH: Kafka - stream.vehicle |
Yes | Yes |
Tenant B: B.process_0 |
No | Yes |
DSH: Kafka - stream.traffic |
Yes | Yes |
DSH: MQTT - stream.traffic |
Yes | Yes |
Adding tracing to your code
In order to collect traces for your messages, you need to add the correct instrumentation to your code:
- Add the tracing endpoint to your service definition. See Tracing for more information.
- See Instrumentation in the OpenTelemetry documentation to learn more about the concepts.
- See Language APIs and SDKs if you want an overview of OpenTelemetry support for some popular programming languages.
Accessing Jaeger UI
On the DSH, you can uses Jaeger UI to inspect traces. Click “Services” > “Tracing” in the menu bar of the DSH Console to open Jaeger in a new tab.
Tip
See the Jaeger documentation to learn more about Jaeger.