Metrics and monitoring
Metrics and monitoring help you track the behavior, health and performance of your applications and services.
- The DSH uses Prometheus to collect metrics. It uses Grafana to analyze and visualize the metrics, and to create alerts.
- The DSH adds a set of default metrics and dashboards to Prometheus and Grafana, but you can add your own.
- If Grafana doesn’t suit your needs, then you can add your own custom monitoring and alerting tool.
Requesting Prometheus and Grafana
If you request a new tenant on the DSH, then the platform administrator typically adds Prometheus and Grafana by default. However, if your tenant doesn’t have these platform services, then you can request them by creating a ticket in the DSH Support Portal:
- Click the “Support” button in the menu bar of the DSH Console. Log in to the DSH Support Portal if necessary.
- Click “New support ticket” next to the search bar.
- Fill out the following fields:
- Tenant: Enter the name of your tenant.
- Platform: In the dropdown menu, select the platform that you want to request Prometheus and Grafana for.
- Requester: Enter your email address, or use the prefilled address of your account for the DSH Support Portal.
- Company: In the dropdown menu, select the company that you request the services for.
- Subject: Enter ‘Request Prometheus and Grafana’.
- Contents: Provide any additional information.
- Click “Submit” to send the request. A platform administrator will process it.
Data flow
This section describes how the DSH handles metrics and monitoring.
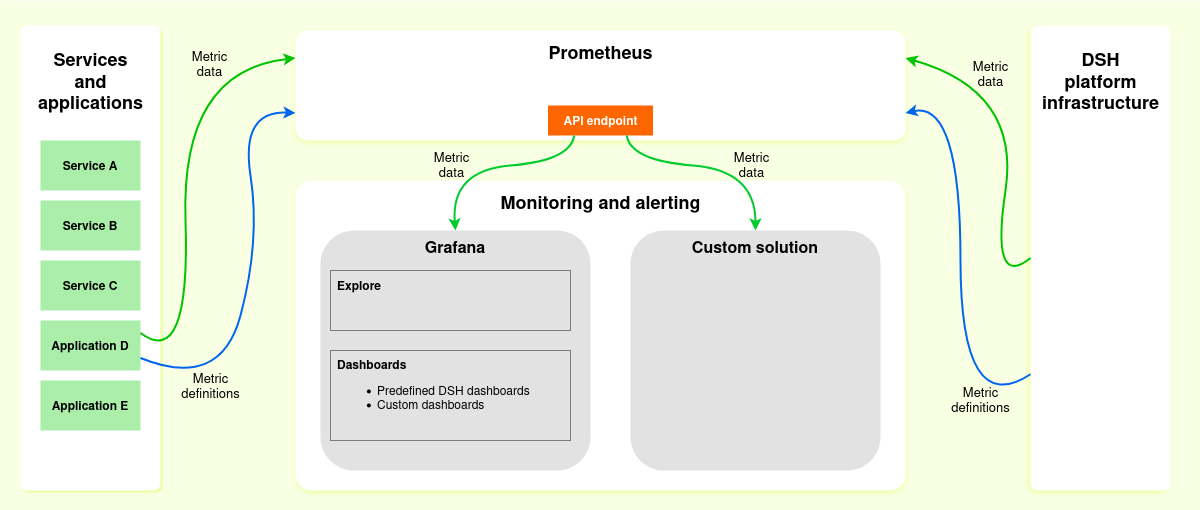
Metric data
A metric is a numerical value that characterizes an aspect of your application or service. The DSH offers a set of default metrics, but you can also define metrics for your own service.
The DSH creates the following metric data automatically:
aws_*orazure_*: Any metrics exposed by your platform’s cloud provider.container_*: A subset of the cAdvisor container metrics.kube_pod_container_resource_*: A subset of the Kubernetes metrics, related to the CPU and memory usage of containers.dsh_romy_*: A set of the DSH’s own metrics, related to the MQTT protocol.go_*,process_*andpromhttp_*: Metrics exposed by the Golang client for Prometheus.net_connttrack_*andprometheus: General metrics exposed by Prometheus itself.scrape_*andup: Scrape metrics exposed by Prometheus.
In addition to the DSH’s metrics, you can define your own metrics:
- You need to add a mechanism to your code to generate metrics, using one of the Prometheus client libraries.
- Using a client library, you can then actually create a metric in your code.
- A metric consists of a name, and of optional key-value pairs called labels.
- Include an HTTP endpoint in your service. Prometheus uses this endpoint to collect metrics.
- Add the HTTP endpoint to your service definition when you deploy your service on the DSH. See Metrics in the service definition for more information.
Prometheus
Prometheus collects metrics about your applications and services:
- The default interval for collecting metrics is 15 seconds.
- Prometheus stores the metric data for 35 days.
- Prometheus exposes the metric data via an API endpoint.
The DSH offers an API endpoint for accessing the metric data that Prometheus collects: tenant-prometheus-service.enclave-<tenant-name>:9090.
Grafana
Grafana retrieves the metric data from Prometheus. You can use Grafana to visualize the metrics, and to create alerts:
- By default, the DSH adds the API endpoint
tenant-prometheus-service.enclave-<tenant-name>:9090as a data source to Grafana. - On the DSH, Grafana also contains the following pre-configured dashboards:
- Allocation vs utilization: Monitors the total allocation and total usage of CPU and memory, across all services and applications.
- Databases: Displays information about your database as a service (DBaaS), such as volumes and instances, performance, and snapshots.
- Kafka Proxy: Displays information about Kafka Proxies in your tenant, such as request rate, response rate, and connections.
- Object storage: Monitors your object storage buckets, such as capacity, transactions, ingress, and egress.
- Service allocation vs utilization: Monitors the allocation and usage of CPU and memory per service or application.
- You can add your own dashboards to Grafana, create alerts, or explore the metric data.
The DSH allows you to add your own solution for analyzing the metric data. In order to retrieve the data from Prometheus, you need to add the following API endpoint as data sources to your monitoring solution: tenant-prometheus-service.enclave-<tenant-name>:9090.
Adding metrics to your code
Prometheus offers client libraries and several instrumentation guidelines for adding metrics to your code. Here are some key points:
- Don’t use metrics as application logging:the DSH collects logs separately.
- Use timestamps for your metrics, not elapsed time.
- Use correct names for metric names and labels:
- Don’t overuse labels.
- Don’t use labels to store dimensions with many different label values.
- Don’t collect personally identifiable information.
- Use the correct metric type: counter vs. gauge, summary vs. histogram.
- Make sure that you don’t miss metrics.
- Use a dedicated thread to collect metrics. Avoid blocked calls, because collecting metrics takes time.
Accessing Grafana
Take the following steps to open Grafana on the DSH, and to inspect the pre-configured dashboards:
- Click “Services” > “Monitoring” in the menu bar of the DSH Console.
- In Grafana, click the menu button and then “Dashboards”.
- Expand the “Tenant Resource Explorarion” folder and click the dashboard that you want to inspect.